Performance is the issue. DobiMigrate is the solution.
Tool performance has become the accepted bottle neck in any NAS migration scenario. We’ve all spent the obligatory weekends, late nights and early mornings migrating data only to be hindered by data migration tools that make migrations problematic and exponentially increase level of effort hours. This begs the question; If time is money, why spend so much of it on antiquated data migration tools??
Tools like Rsync and Robocopy are free. We like free, but (begrudgingly) tolerate their slow performance which leads us to splitting migrations into multiple outages and spending even more time on monitoring and remediating many smaller migrations. Further, rolling back a migration because of slow performance and missed outage windows is not uncommon and let’s not even get started on the amount of scripting required.. or the fact they are unsupported.
One thing is for certain, nothing groundbreaking has happened on the performance front in many years with host based migration tools (free OR fee-based) and they have been bereft of any significant functional upgrades for 20+ years. That’s right.. many of these tools were created during a time when we were still using folding maps, rotary phones, cassette tapes and wrist watches (don’t worry, you can still wear them for bling). For over 20 years, we’ve been conditioned to accept their slow performance, lack of functionality and difficult usage as the norm.
Hmm.. So, how does performance affect the level of effort on a migration project and how does that equate to skyrocketing project costs?
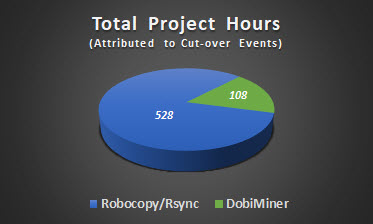
Excellent question! To claim a tool’s performance doesn’t impact the level of effort and associated project costs is to ignore the duration expense of any migration project. Simply, slow migration tools directly correlate to additional cut-overs, level of effort from project resources and a resulting skyrocket in project costs. Acknowledging this, if your migration tool reaches optimal performance, project costs are greatly reduced. However, the reverse is also true. Let’s take the real-world example below which represents the forecasted hours of effort for migrating a billion-file environment based on cut-over/outage windows alone:
| 1 Billion Files | Outage Windows | Outage Duration | Project Resources | Total Hours | |||
| Robocopy/Rsync | 11 | × | 8 | × | 6 | = | 528 |
| DobiMiner | 3 | × | 6 | × | 6 | = | 108 |
Five times reduction in costs
But wait, there’s more! This example above doesn’t account for all the other project resource costs associated with cutover windows such as project and change control meetings or the hours end-users are required to perform user acceptance testing. For a typical migration project these items easily account for an additional 30% or more.
In this example, DobiMigrate allows you to reduce your overall project hours associated with the data migration by nearly five times. Want even better performance returns? Seamlessly add additional copy engines, in flight, from the centralized global console; instant performance gains. This unlimited scalability puts DobiMigrate in a league of its own.
DobiMigrate changes all this by introducing scalable performance to data migration. Yes, truly scalable to any environment from small to enterprise. It’s not a catch phrase. While other tools offer the ability to adjust the number of copy threads while being restricted to a singular scan thread, DobiMigrate allows you to scan the same file system from multiple scan engines allowing scanning speeds to increase exponentially. As seen below, DobiMigrate delivers a 7x to 13x copy performance compared to legacy tools:
Slow copy performance, extra outage windows and inflated project hours should no longer be accepted as the norm.
DobiMigrate delivers true, scalable performance and it does so with industry leading automation to reduce level of effort within every phase of your migration project. And, if you order now, we’ll throw in an extra DobiMigrate coffee mug, a value of $39 to your order for free!! Just pay the added cost of shipping and handling, return at any time.
For more information or to setup a demo to see this for yourself, please contact us
here
If your wondering how we came up with the comparisons above, please find the tab configuration and testing methodology below.
| Lab Component | Description |
| Network equipment used | Dedicated, rack mounted 10GbE network switch, SFP+ & RJ45 ports. 320Gbps capacity, 160Gbps throughput. All tested components connected to single switch. |
| Source storage controller: | Enterprise class, physical storage controller from mainstream storage vendor with 2-nodes, 42 Disk physical volume |
| Destination storage controller: | Enterprise class, physical storage controller from mainstream storage vendor with 2-nodes, 22 Disk physical volume |
| Copy hosts | VM’s with 16GB of memory, 10Gb. Idle VM infrastructure. |
Lab notes
- Lab used created specifically for and dedicated to performance testing
- For Duration of testing, no other loads were placed on any component within lab
- All migration tools tested from same Linux/Windows host
Testing methodology:
- Best practices used for each tool
- Multiple iterations of each test completed, best results for each tool used
- All iterations completed sequentially. At no time were two tested performed concurrently
- All performance numbers derived from actual time to completion, not time reported by each tool


