*New* Filesystem Analytics Eliminates Guesswork
The latest release of the DobiMiner Software Suite is here, and it comes with significant enhancements. One of the most important new features of Release 5.6 is filesystem analytics, which greatly improves visibility into the characteristics of an unstructured dataset.
Filesystem analytics adds new visualizations of the dataset being migrated, replicated, and/or sync’d. These analytics-based visualizations allow administrators to review filesystem characteristics at several levels: the individual path level, the volume/filesystem level, the filer level, and even aggregated views of multiple filers across all protocols. This allows administrators to quickly determine:
- if there are large collections of small and/or large files
- what the depth and breadth of directory structures appears to be
- the age distribution of data, and
- what file types dominate the population of files.
Getting the big picture, one file at a time
Here is why insight into this type of data is so valuable: Performance of file copies is affected by the potential inefficiency of small files, narrow and/or shallow directory structures, or even a combination of the two. At the individual path level, the visualizations can help explain why two seemingly similar paths (in terms of capacity) require different amounts of time to synchronize.
Put simply, a picture is worth a thousand words and replaces a significant amount of research and guesswork.
In Figure 1, we see an example of filesystem characteristics aggregated based on the ‘AnySource’ to ‘AnyDestination’ NAS pairing. The view displays several histograms showing file sizes, directory sizes, file modification times, and directory depths detected and can be changed to display the various categories of files detected.
Figure 2 shows the ‘File Category’ view where we can view both the types of files and the number of each file type that have been detected, along with its associated capacity.
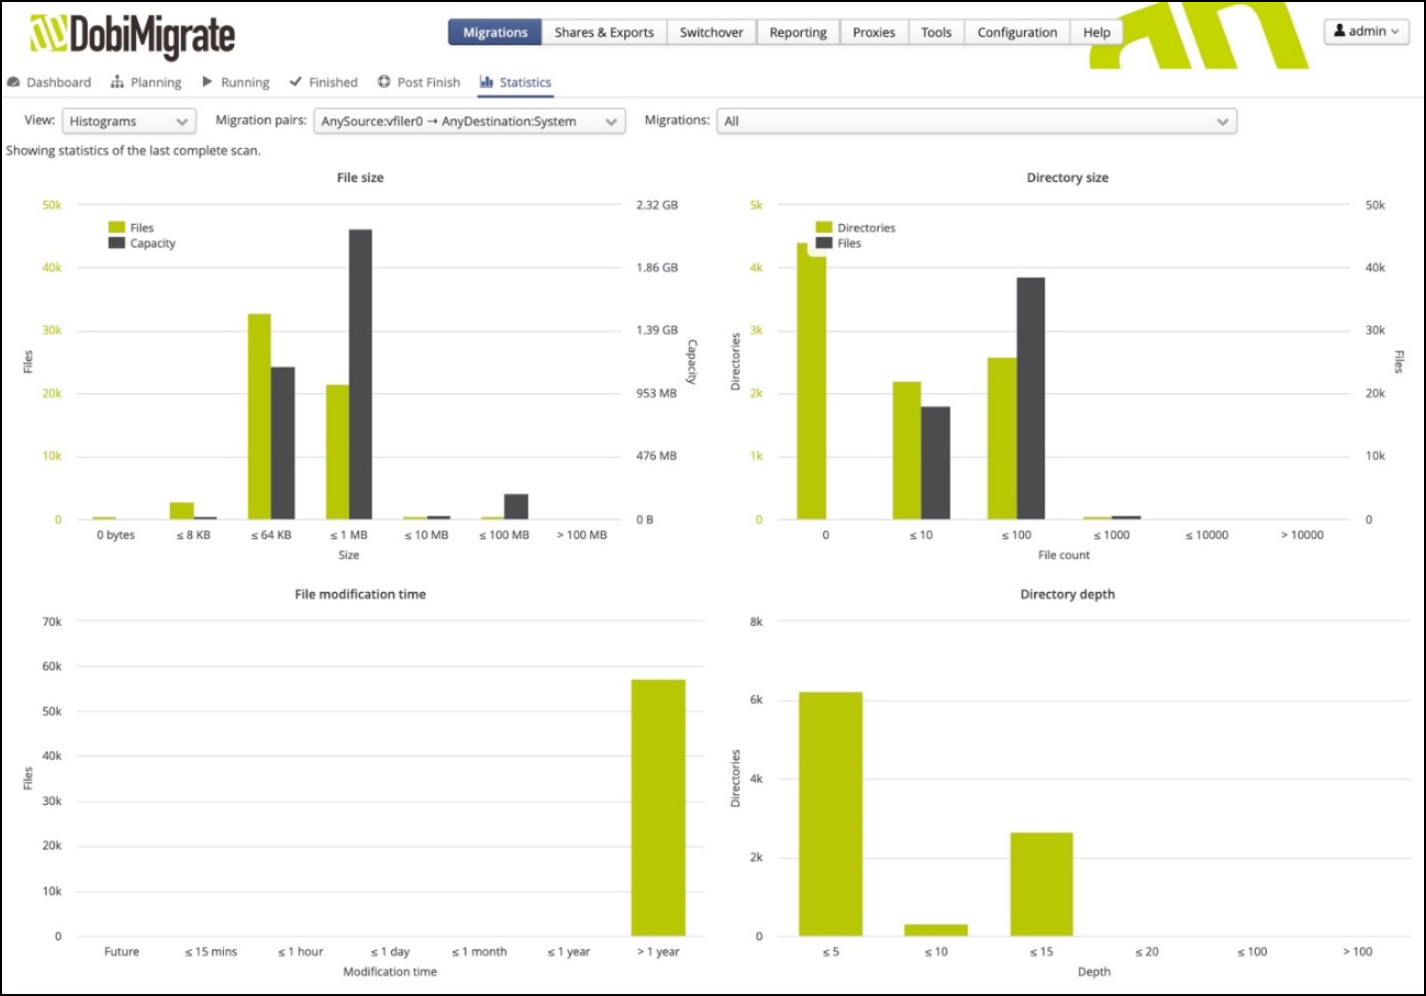
Figure 1. Aggregated view of filesystem characteristics in the DobiMigrate package
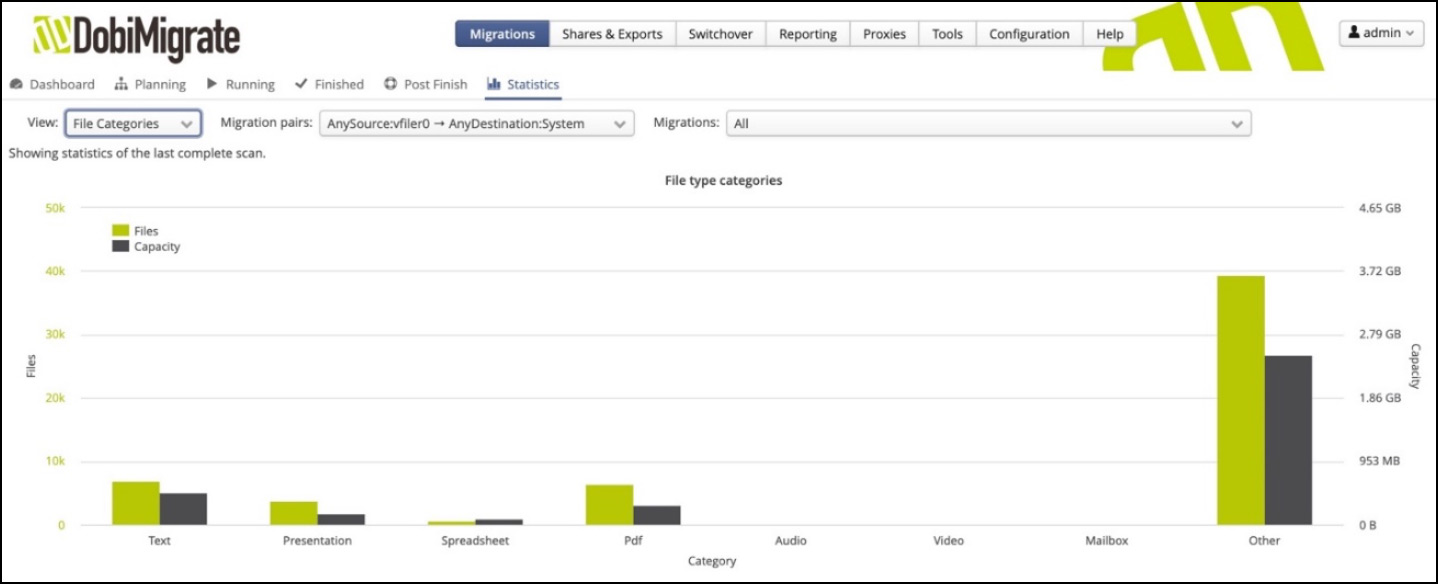
Figure 2. Breakdown of file categories detected
Interestingly, while the views in Figure 1 and Figure 2 present aggregated data across all paths between the ‘AnySource’ and ‘AnyDestination’ pairing, it is also possible to view the same data at the volume/filesystem level or even at the individual path level.
Figure 3 illustrates how a single path can be viewed. The traditional history associated with the activities such as first scan, first copy, and the most recent steady state iterations are all there, but we now see a scrolling list of charts that show characteristics specific to the path selected.
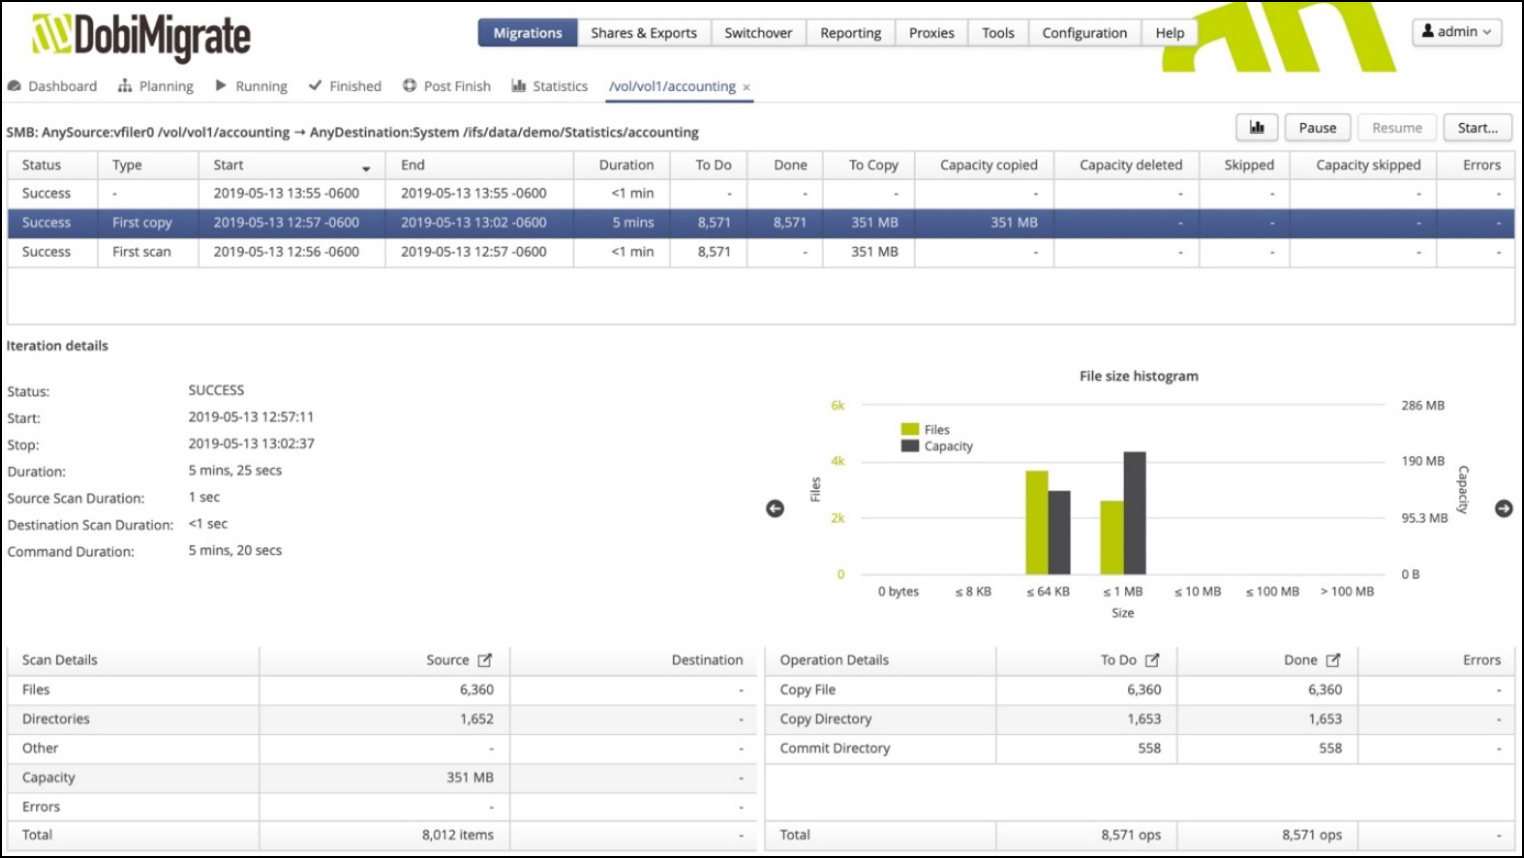
Figure 3. Path-level visualizations
Better visibility = better efficiency and performance
To give the administrator a big picture comparative view across paths, the Planning tab now includes a small histogram embedded at the path level showing the major file size categories summarized for each path. This makes it very easy to determine which paths will be less efficiently copied compared with others. Figure 4 shows this new embedded visualization.
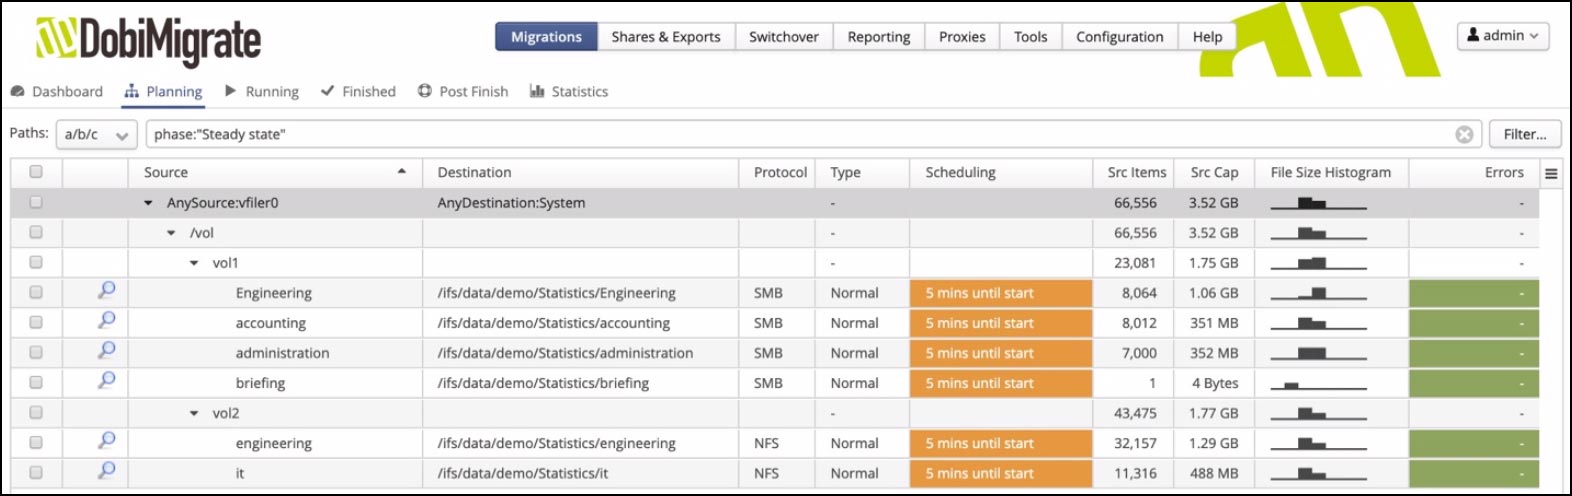
Figure 4. Embedded path-level file size histograms
Each time an administrator adds a new path or collection of paths, the summary-level file size histogram is added, and the aggregated histograms described earlier are updated. There is now excellent visibility into the critical aspects of the datasets being copied by the Datadobi Software Suite – whether it’s DobiMigrate, DobiReplicate, or DobiSync.
Learn more
To get more information or to request a demo, email us at [email protected].